The 4 Most Common Mistakes in Mobile A/B Testing
A/B testing is a learned skill. Like any skill, you get better at it over time by doing it and by making mistakes. However, learning from other people’s experience helps you skip the early mistakes and jump to the advanced mistakes.
Here are 4 early stage mistakes that we’ve seen many apps make. Learn from this list and skip over these mistakes when you start A/B testing your app.
1) Not tracking enough (or the right) metrics
Scenario: I made a change to the buy button and tracked clicks on that button. After 4 weeks of running the test, I see that the button has statistically significantly more clicks. Amazing! But wait, there are 3 more steps between clicking that button and completing the purchase. Did the change actually increase final purchases or did it encourage more users to click the buy button without actually doing anything for purchase?
No matter good story or bad story, it’s not the full story unless you track the entire funnel.
On the flip side, how do you know if you’ve tracked enough metrics? You also don’t want to track every metric in your entire app. If you look at too many metrics, some of them are bound to seem positive. After all, 95% statistical significance means that 5 out of 100 results are going to give you wrong answers.
The key to avoiding this mistake is to ask yourself a few questions:
– How will you know if the A/B test is a success (or a failure)?
– What metrics must you track in order to determine A/B test success?
– Once you’ve selected your metrics, check with yourself, “If all these metrics showed highly statistically significant results, would that be enough information for me to push this new variant out to all my users?”
These questions could have helped me avoid the scenario mentioned above. I would have quickly determined that statistically significant results on the button click alone would not have been sufficient.
2) Not planning out the user requirements first
Scenario: I want to test the impact of a button change on the very last step of the checkout process. Less than 1% of my users ever see this view, but I believe that changing the conversion rate at this step from 80% to 85% would greatly improve my revenue. I have 3 ideas I want to test so I run a test with 3 variants to improve that conversion rate. After running the test for several weeks, I don’t see any statistically significant results.
The mistake here was that I didn’t do the math in advance to see if I had enough users to perform the test I wanted. I quick calculation using shows that I need roughly at least 1,000 users to get statistical significance. That doesn’t seem so high, but if I consider that only 1% of my users see this screen, I need 100,000 users. Some apps get this many of users in a day, but if my app only has 25,000 MAUs, it’s going to take me 4 months to reach statistically significant results. And that’s ONLY if I actually am able to improve the conversion rate from 80% to 85%. If I actually get less than a 5pt improvement, then I need to wait even longer.
The correct approach is to do a rough calculation of how many users I need first just to make sure I have an approximate idea of what percentage of my users need to be allotted to this test and how long I’ll have to wait before stopping the test. There are a few resources out there to help you do this including this one and Apptimize’s test design tool.
Planning the user requirement in advance would have shown me that I needed to reduce the number of variants I tested. If I still didn’t have enough users to run this test in a reasonable amount of time, I would need to move up the funnel where I had more users.
3) Stopping the A/B test too early
Scenario: I run an experiment for 3 days and see statistically significant results. I’m elated at how well that test run so I stop it and push out the winner to all my users.
Stopping A/B tests too early is a really great way to get a lot of false answers. If you run a test for a short period of time, high frequency users will represent a disproportionately high percentage of the users experiencing the test just by chance. If your high frequency users like the change, you’ll more likely see a positive result in the first few days. If the test runs for a month, you’ll start to capture a more holistic view of the user base as people who only use the app once a month trickle in.
Airbnb had this exact experience when they tested a change to their price sliders.

Their results showed high significance after a week of running the experiment but then tapered off into insignificance.

A good rule of thumb for how long to wait is to think about how long your user cycle typically is and run the test for twice the user cycle. By user cycle, I mean the lag between opens for your average user. For many apps, this is one week. For some apps (such as a banking app), this could be a month. If you run the test for at least 2 user cycles, this increases your chance of capturing both high frequency users and seldom users.
4) Thinking that all users behave in the same way
A/B testing generally captures aggregate data about your users. However, all your users are not the same person. Version A might be better for most of your users, but there could a subset of users that prefer version B. It could random which users preferred version B, but there could also be a common characteristic that cause those users to like version B.
This is where segmentation and user targeting comes in. When running A/B tests, it’s important to dive deeper into the data to gain more insights. Here https://apptimize.com/blog/2014/06/how-segmentation-can-correct-misleading-ab-testing-results/ is a previous post about an Apptimize customer who was able to correct misleading results by reviewing segmented data.
The aggregate view of their results showed a negative effect of the new variant. However, segmenting the data by OS version showed that the negative effect was due to the variant having an issue on older versions of Android.
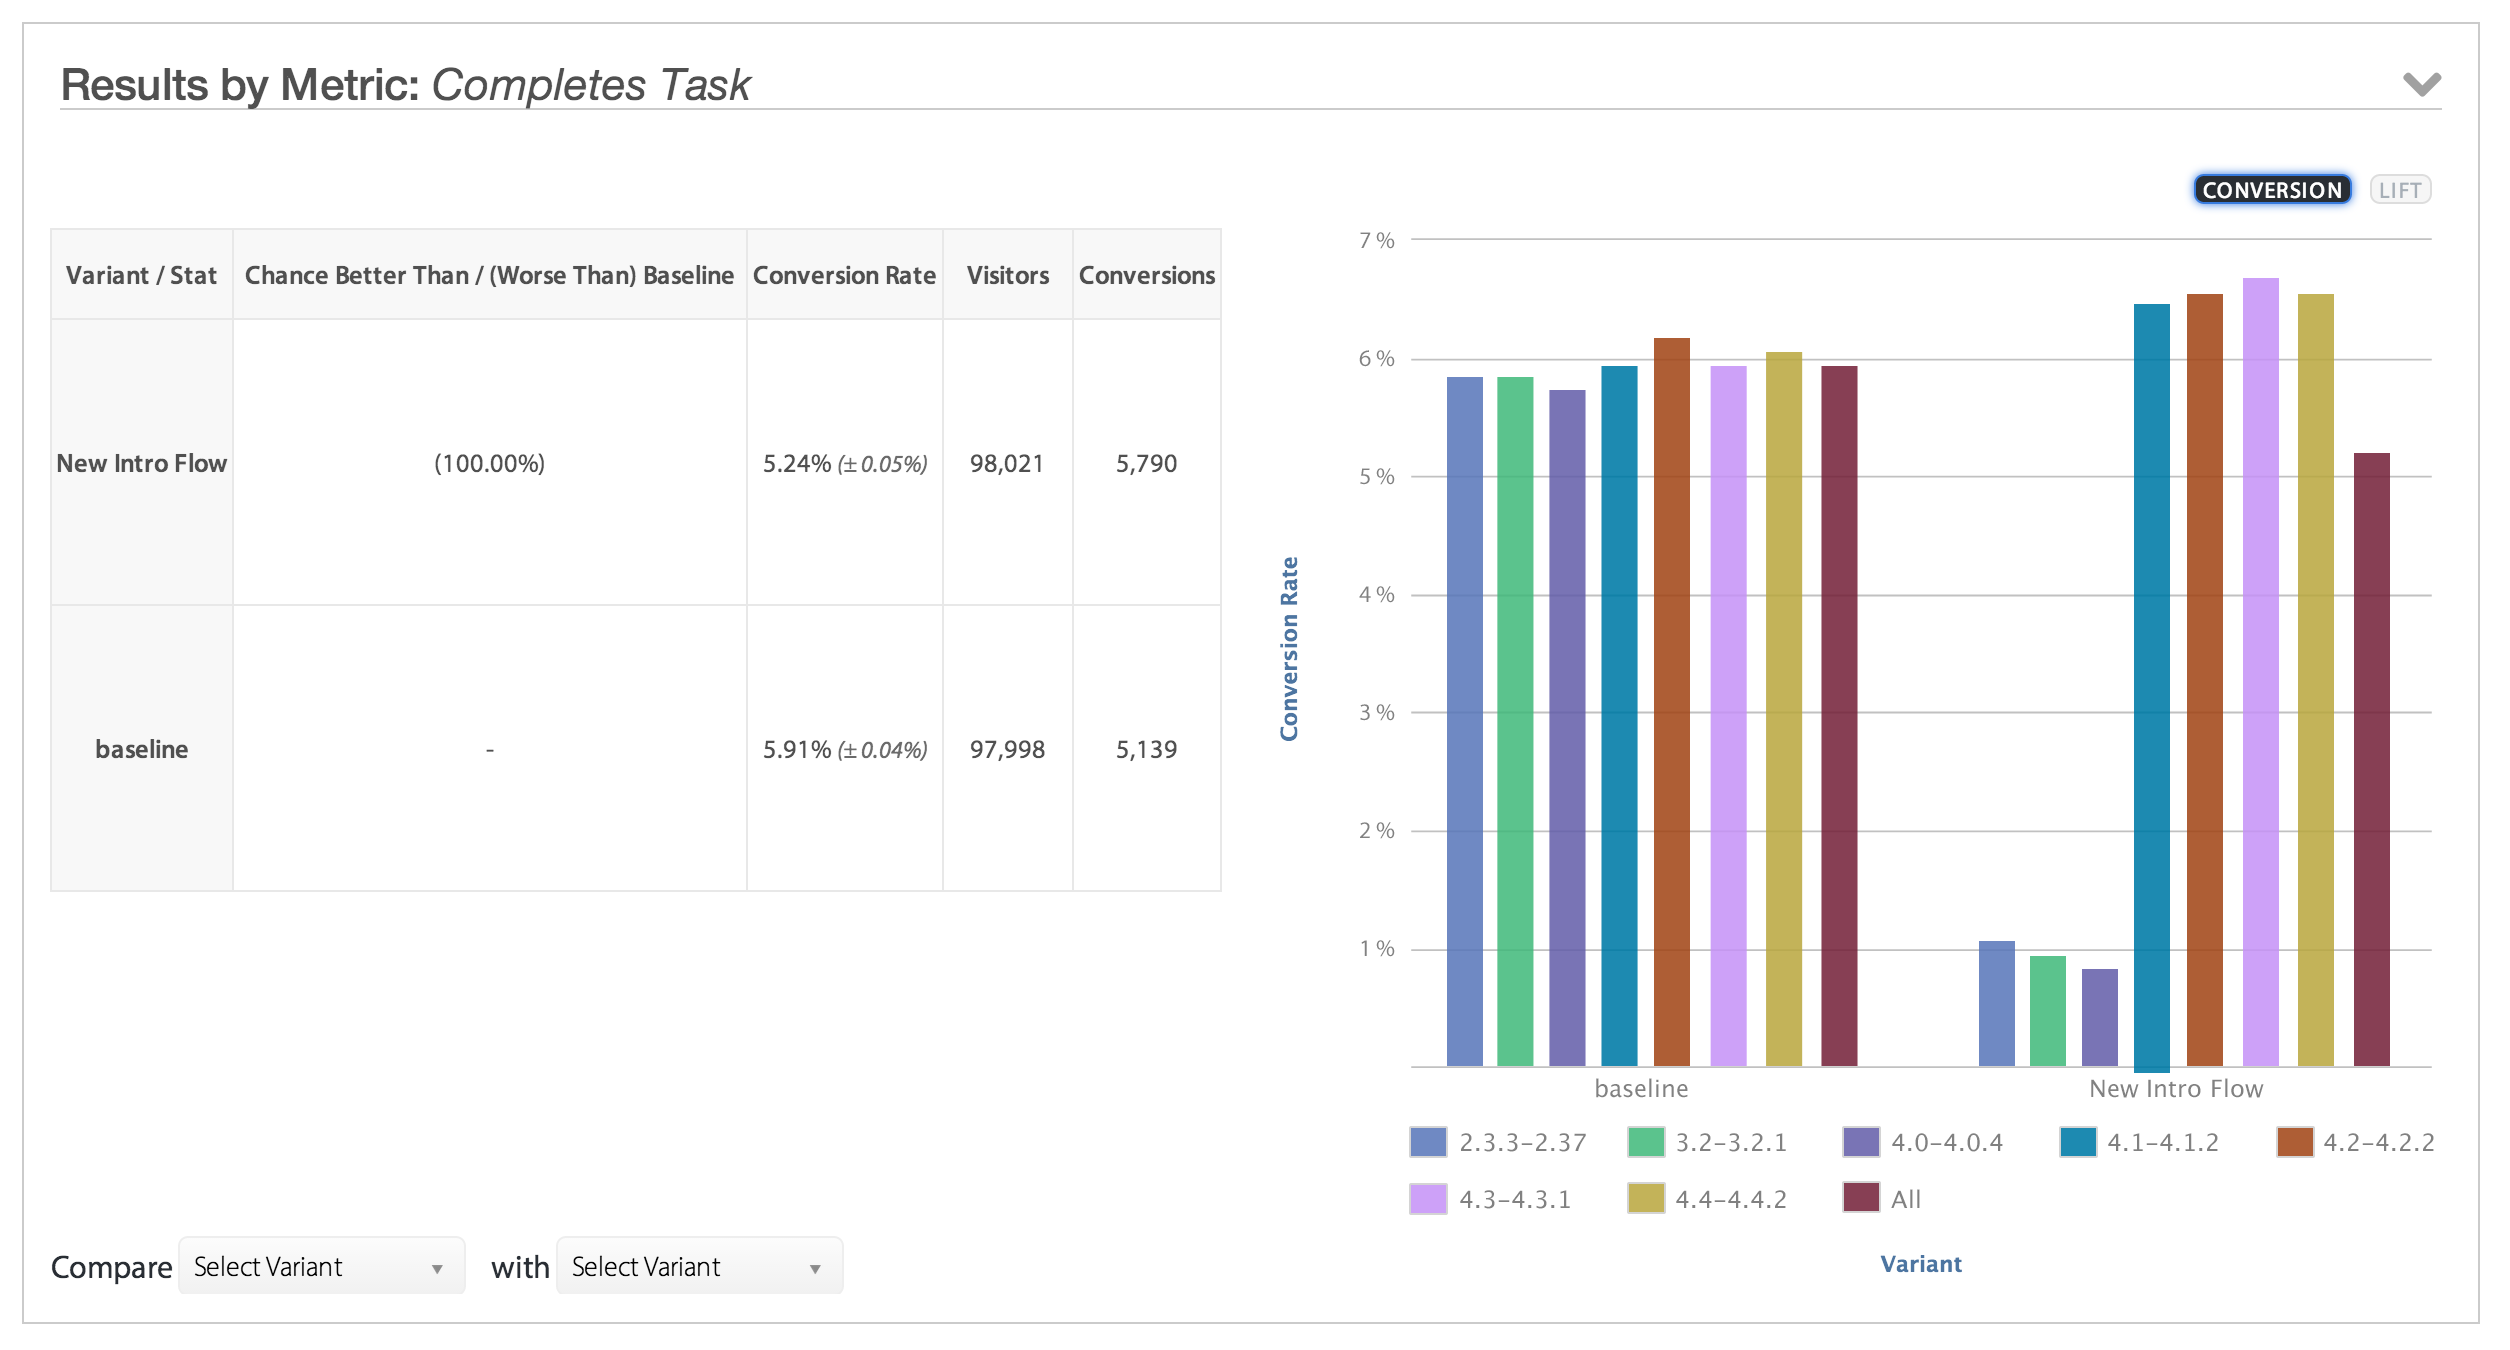
This type of effect is not limited to technological differences. There’s also a possibility that geography, demography or prior behavior are good indicators of differences in user preference.
Thanks for
reading!
More articles you might be interested in:
7 Things to A/B Test in Your Mobile App
We hear from customers that planning out your second, third, and fourth A/B tests is one of the hardest things to. Many app managers have a first test in mind when they start experimenting and planning out a series of...
Read MoreGet Started with Mobile A/B Testing using ONE Easy Test
I talk to a lot of app developers and product managers on a regular basis about A/B testing their mobile app. The feedback I hear the most is: “I know I need to start A/B testing, but we just haven’t...
Read MoreHow to Evaluate a Mobile A/B Testing Solution
How do you know which mobile A/B testing solution is right for you? Ask for a demo. Signing up for a trial is a great start. Seeing a live demo is even better. With a live demo, you can watch...
Read More