App UX Analytics: The Key to Understanding your Users’ Behavior
This is a guest post written by Alon Even of Appsee.

In the highly competitive world of apps, you need to fully understand the user experience. You need to know how users are using your app. You need to know where they are getting stuck, experiencing friction and refining to optimize the user experience.
Apps that succeed in today’s mobile market deliver an optimal mobile user experience that goes far beyond the design of the app itself. Apps that stand out tend to deliver a user experience that wows users and results in increased retention, conversions and in-app monetization. Most importantly to app makers, it will also boost their users’ LTV (Lifetime Value).
Going Beyond Traditional Analytics: Quantitative vs. Qualitative Data
Traditional mobile analytics tools provide you with quantitative data and emphasize key metrics, such as number of new users, engagement, user retention and geographic breakdown. However, in order to truly understand the why behind the numbers and see the full picture, you need to deep-dive into the user experience and focus on qualitative data. This is where App User Experience (UX) Analytics takes center stage.
Here’s a good metaphor. Say, someone told you about an amazing rain forest they trekked in Costa Rica. That is like looking at traditional mobile analytics. Now, say someone showed you pictures of that rain forest. Now, you add visual input and you can understand the experience at a much higher level.
Using traditional analytics, like what Google Analytics offers, you can analyze how many users dropped off a certain screen. But, is that really enough to understand why your users performed certain actions? App UX analytics, like what Appsee offers, empowers app makers to go a step beyond and gain visual insights, allowing them to further examine the user behavior, refine the UX and streamline the app optimization process.
There are two key features that differentiate UX analytics solutions from traditional analytics solutions: user recordings and touch heatmaps:
- User recordings enable you to watch active user sessions in real-time and see exactly how users interact with your app through their eyes, as well as when and where in the app there is friction. By analyzing these recordings, you are presented with information which will help you learn which problems your users encounter and why they don’t complete important processes within your app (such as in-app purchase and mobile onboarding).
For example, the recording below shows a user who cannot create an account with Facebook due to a technical problem, as indicated by the pop-up message, highlighting why users are dropping off the registration screen.
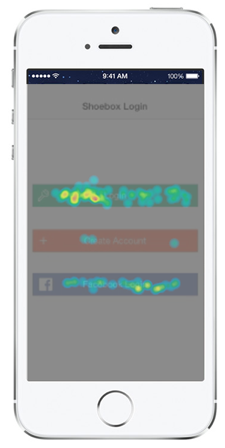
- Touch heatmaps aggregate all user gestures (taps, swipes, pinches), allowing you to see where your users are focusing their attention the most, and help you gain an understanding of how your app’s UI is performing and detect which gestures did not trigger a response in the app.
For example, you may come to the conclusion that a call to action (CTA) button needs to be moved a few pixels up, or one of the features is being ignored by your users, presenting you with visual information that will lead you to improve your UI design.
Optimizing your App with UX Analytics
I’m a big believer in using quantitative alongside qualitative data from day one for app optimization. Quantitative data can pinpoint where the trouble areas of your app lie. Using the qualitative benefits of visual analytics will help you find the reason for the trouble. App UX analytics solutions provide both of these types of data, and help you optimize critical processes within the app. Here are a few examples of how UX Analytics can be applied to improve and optimize the mobile experience:
- Mobile Onboarding Experiences
Think of onboarding as an entry ramp onto your app. It’s the user’s first experience with your app. The key here is to wow them, so they continue using it. An onboarding experience should be a dynamic mix of UI that contributes to an engaging and smooth overall mobile user experience.You witness a dropoff rate of over 50% from the third tutorial screen in your onboarding process. But more is needed to understand what is the root of the problem. When you go back to watch user recordings (bottom-up approach), you see that the “Next” button wasn’t showing and users were getting frustrated and tapping all over the screen to proceed with the tutorial.
By analyzing the touch heatmaps (top-down approach), you notice unresponsive user gestures on the third tutorial screen which helped you deduce that most of your users encountered this problem. You go back to your developers and they fix the problem, thereby realizing a significant decrease in users who drop from the app and an increase in user engagement.
- User Retention After the initial user experience with your app, you want to be able to gauge how many people come back after that first experience. This is measured by your retention rate. User retention is just like it says. You want to retain your users after that first launch, ultimately as much as possible and well beyond that first use.
When you get users to download your app, you’ve only won half the battle. Getting them to stay and become active users is key to a successful app. A retention cohort analysis in October can show you that you retained over 85% of your users who came on board in September. In November you notice a sharp decrease just after you launched a new version.
By conducting an analysis of touch heatmaps and UI reports, you see that when users leave your app and come right back, they are requested to login again. For this reason, they were trying to swipe right in order to bypass this screen and continue their session from where they left. You notice them getting frustrated when the swipe right action is not functioning, remove this login screen from the new version and see your retention rate stabilize once again.
- App Conversions
A high retention rate for an app is great, but having a high retention rate only increases the chance that users will convert. It doesn’t mean they will though. You need to make sure your conversion funnels are slick with no hiccups. No friction. Your funnels must make the user say: Yes, I must have this. NOW.
A key component of app conversions is the in-app purchase.This is when the user in the context of using your app is offered a special deal on an item or a group of items. This area is vital to your app’s health, as the conversion funnel must be seamless on the way to checkout. Now, users are adding the items they would like to purchase but they don’t complete the checkout process. In other words, you are leaving money on the app table.
By watching the crash recordings, you can see the exact sequence of actions that resulted in a crash and reproduce how the crash came about. You notice that when users click on that “Buy Now” button the app crashes. Obviously, fixing this crash will result in a significant increase in ARPU.
Monitoring and understanding your users’ behavior goes beyond traditional analytics, and is imperative to optimizing your app. Maximizing the user experience utilizing App UX Analytics is the key to app optimization and will create a steady flow of app income.
Bio: Alon is VP Marketing at Appsee Mobile App Analytics. His areas of expertise are online marketing, mobile analytics, and mobile UX. Before joining Appsee, he worked in various marketing & business development roles, helping startups grow. You can connect with Alon on LinkedIn and on Twitter
Thanks for
reading!
More articles you might be interested in:
Apptimize at Apps World 2015 – How to Retain App Users
Last week, Apptimize was down at Moscone Center West in San Francisco for Apps World North America. It was a great event and we’re happy we got to spend some time talking with our customers as well as a bunch...
Read More5 Things Analytics Won’t Tell You About Your Mobile App
1. Is your conversion rate good? 2. Are your engagement and retention rates good? 3. Are the new features and design changes you make actually improving your top goals? 4. How can you grow your user base? 5. What actually...
Read MoreHow Will Amazon Fire Affect Your App’s Users?
Amazon’s unveiling of their new phone has set the tech news world aflame today (yes, bad pun intended). While this is exciting news, app owners must wonder how this phone is going to affect users’ experience in every other retail...
Read More