Details and Goals
After installing the Apptimize SDK, you’re ready to set up your first experiment!
From the Dashboard, click Create in the upper right and select the A/B Experiment project to start a new experiment.
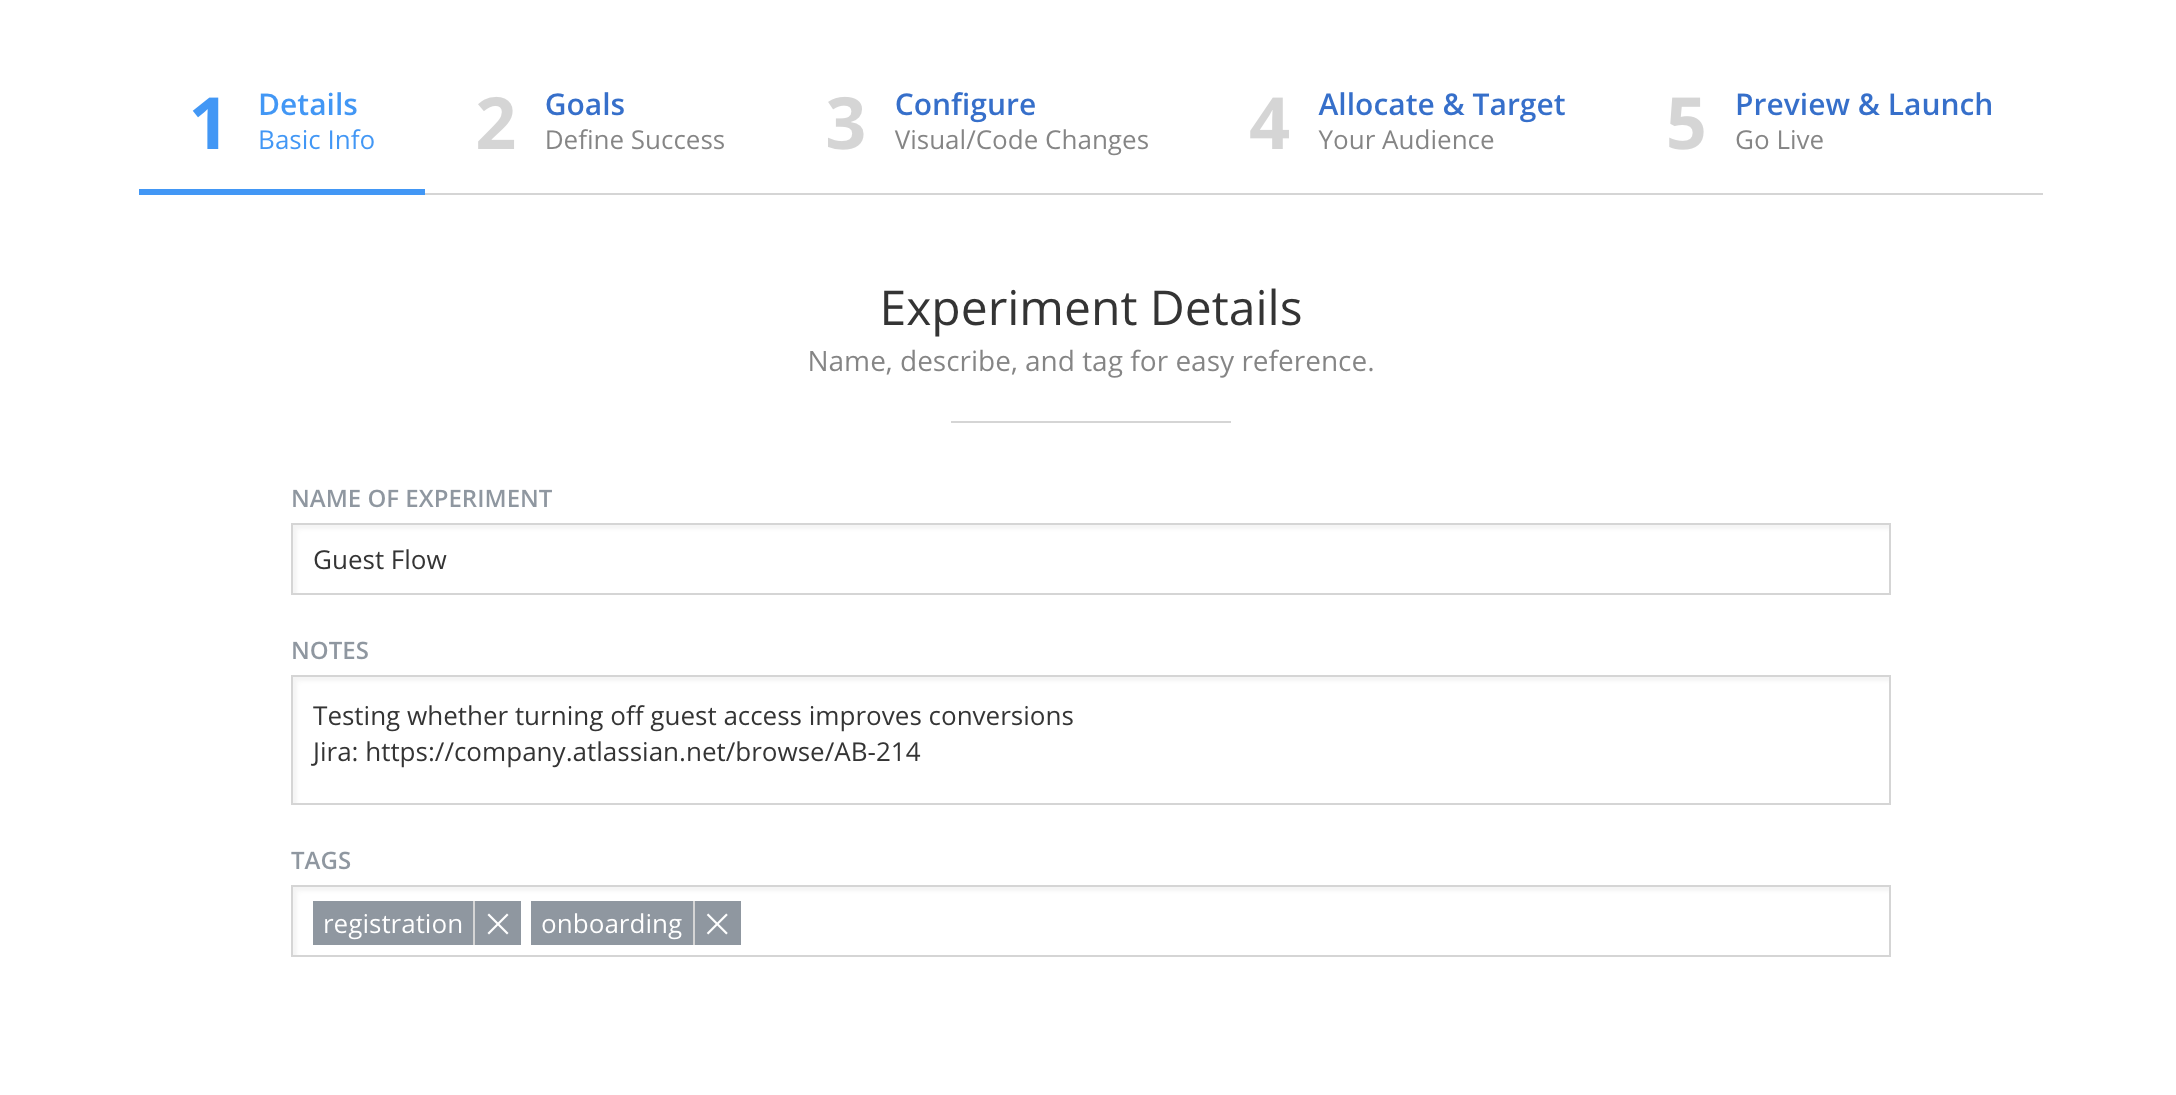
Experiment Details
To get started, give your experiment a name and description that will allow you to easily reference it later. Descriptions may include a brief synopsis of what is being tested, links to any external docs or tools (such as JIRA), and the overall goal for the experiment. Add tags to organize your experiments and easily search and categorize them on the dashboard.
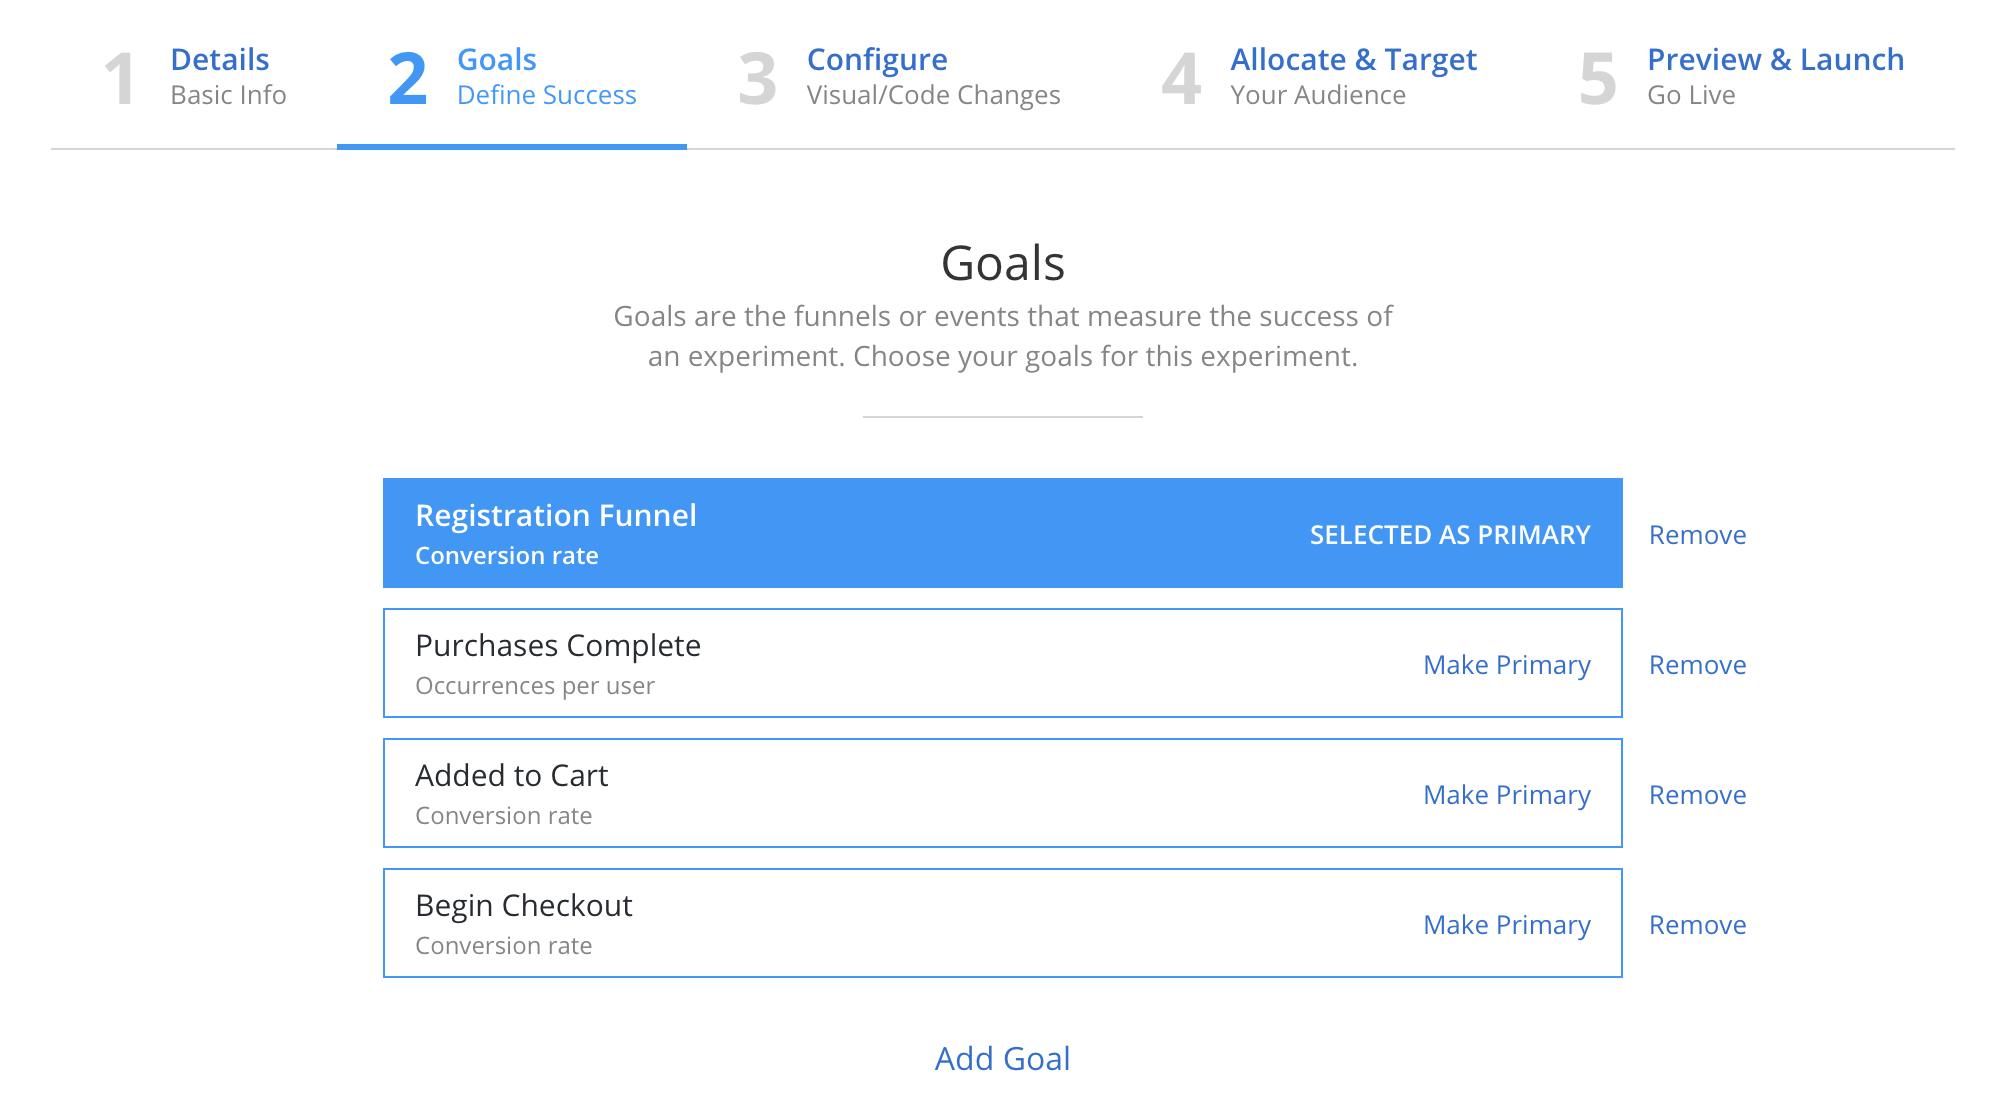
Goals
On the goals page, specify the event(s) that will define success for this experiment. The “primary goal” is the most important goal for this experiment. In an onboarding experiment, for example, overall purchases may be the primary metric for success. You may additionally want to track registrations, and also types of registrations (e.g. Email vs. Facebook). All events and funnels added on the goals page will also be shown on the results page.
If your event or funnel does not exist, you’ll need to create it before adding it as a goal. See events and funnels for more information.
Apptimize allows you to customize the way you track event goals in several ways: conversion rates, occurrence per user, value per user and value per occurrence.
Metric |
Definition |
Sample Use Cases |
|---|---|---|
Conversion rate |
Percentage of total participants who have triggered the goal event at least once. Example: 10% first time users converted to purchasing |
First time payer conversion measurement: did new variant convert more new users to pay for the first time? |
Occurrence per user |
Number of times the goal event was triggered divided by the total number of participants. Example: average 3 purchases per user |
Custom engagement measurement: did the new content recommendation algorithm entice users to watch more movies? |
Value per user |
Total event value per participant. Example: average $3 spent per user |
General monetization measurements: did new variant increase dollars / users in general? |
Value per occurrence |
Total event value per event occurrence. Example: average purchase size is $2 |
Shopping basket size measurements: did new variant cause users to spend more dollars each time they shopped? |
Conversion funnel |
Percentage of users who completed all funnel steps in sequence out of the users who completed the first step. Example: if 50 users complete the first step of the funnel, 25 of them then complete the second, and lastly 10 of them complete the final step, the funnel conversion rate is 10 / 50 = 20%. Users need to go through funnel steps in sequence to be counted for the conversion calculation however there can be other arbitrary events in between funnel steps. |
User experience flow measurement: did the new onboarding flow work better at educating new users and convert more of them to use the core product for the first time? |
Apptimize also has custom engagement and retention metrics besides custom event goals. Please see events and funnels for more details.