How to Optimize in a Fragmented Android Ecosystem
While the latest version of iOS is running on a whopping 90% of all Apple mobile devices, recent studies show that only 17.9% of Android devices are running KitKat.
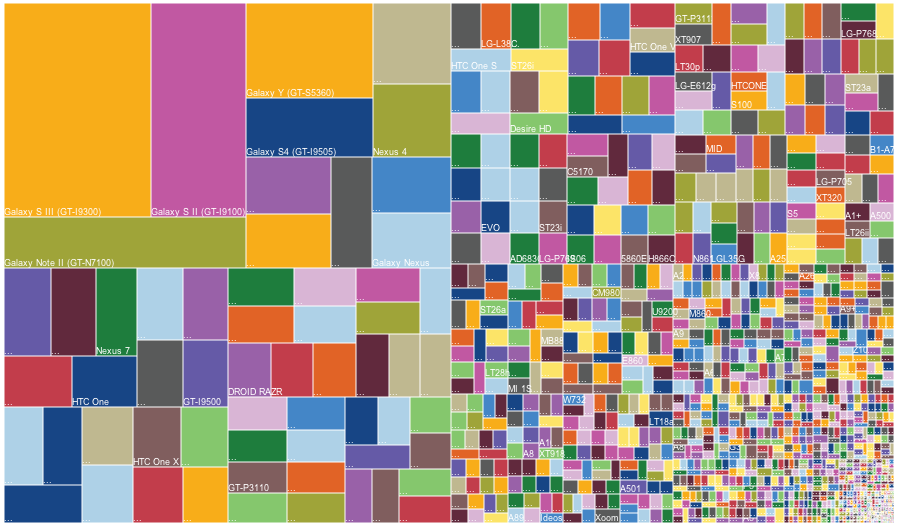
Fragmentation on the Android platform is only getting worse. We’re now seeing 12,000 different Android devices (with different screen sizes and screen resolutions) around the world along with 46 major OS release (not to mention different manufacturer skins and optional add-ons like ART). Even before the different carriers that can be added to the mix, we’re looking at millions of different possible experiences that users can have.

Graphic by Opensignal
So how do you optimize THE user experience on Android when the user can have so many different experiences? A/B testing is still the solution, but the key is to analyze A/B testing results by the most common combinations of device and OS of your users.
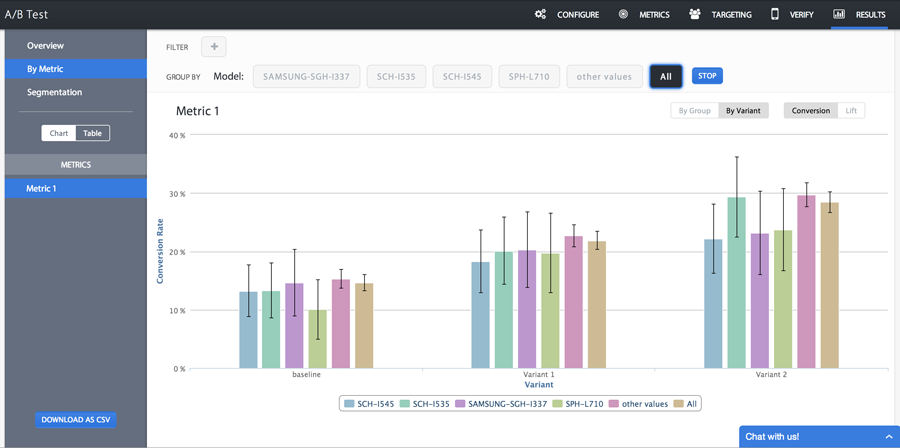
Most of the time, the segmented results of an A/B test look like this:

These are real results with the names of the test, variants, and metrics changed. As you can see, when we segment by device model, there are no distinguishable differences between the different models. There are some differences, but they are not statistically significant and don’t tell a story.
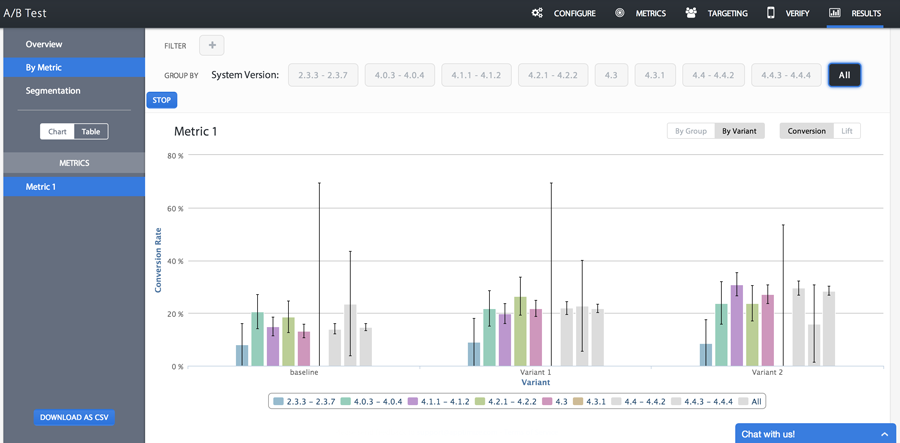
But sometimes, the results look like this:

This is the same test, but the results are segmented by Android OS version. The team that developed this test immediately noticed that something was going on with their app on Gingerbread. It turned out that the change being tested in the app was leveraging an API call that was not available in Gingerbread. Therefore, Gingerbread users were all seeing the same version of the app regardless of which variant bucket they were allotted into.
This particular test was statistically significant despite the fact that 5% of the users were not truly seeing different variants of the app. Had the variants been less significantly better than the baseline (original) version of the app, removing the Gingerbread users may have made the difference between an unsuccessful test and a successful one.
The lesson learned here was that dissecting the results is ever more important when the ecosystem is so fragmented. This app team leveraged the proven hypothesis of this test to also make modifications to the Gingerbread version of their app.
Thanks for
reading!
More articles you might be interested in:
Optimize Marketing Campaigns in Real-time for Native iOS and Android
A/B Testing Example – Retale, a location-based app that aggregates retail circulars, ran a Black Friday campaign in the weeks leading up to November 28, 2014 that increased their product click-through rates in the busiest shopping week of the year. While...
Read MoreOptimize Your App for the New iPhone 6 Sizes
Apple announced the new iPhone 6 today. Or more accurately, Tim Cook announced the new iPhone 6’s. You’ve probably already heard. The iPhone 6 is available in 2 (TWO!) sizes. While market watchers are wondering if Apple is coming too...
Read MoreAndroid Visual Apptimizer Beta
iOS customers have been using our Visual Apptimizer, a what-you-see-is-what-you-get visual real-time editor, since we launched it in January. Today, we’re announcing the beta of our Android Visual Apptimizer. Now, Android A/B testers can also enjoy: A/B testing without having...
Read More