How Segmentation Can Correct Misleading A/B Testing Results
When looking at A/B testing results, just seeing that one variant is statistically significantly better than another sometimes does not tell the whole story. As experimenters and business decision makers, what we really want to know is why. Did users respond to badly to a new item sorting algorithm because it put less appealing items at the top of their list or because the code was unresponsive? Is the existing menu layout truly more intuitive or is the new layout simply foreign to existing users? These are the types of the questions that cannot be answered by simply looking at aggregate results. Looking at segmented data is the first step to digging deeper and finding insights.
Here are a few common scenarios we’ve seen at Apptimize when segmented data has helped reveal a lot more about the results than meets the eye.
Technology Specific Failures
With complex variants that require large amounts of new code, you may have tested as thoroughly as you can but missed some critical responsiveness issues on some devices (either to due to operating system version, internet connectivity in some geographies, or the device itself). The fragmentation in the smartphone industry these days can be a huge pain for developers. Designs and features that customers would otherwise love could receive bad reviews because of load time, responsiveness, and crashes rather than the usability of the original idea.
For example, you could be testing out a new intro to your app and find that it’s underperforming compared to the original (baseline) version of the app.
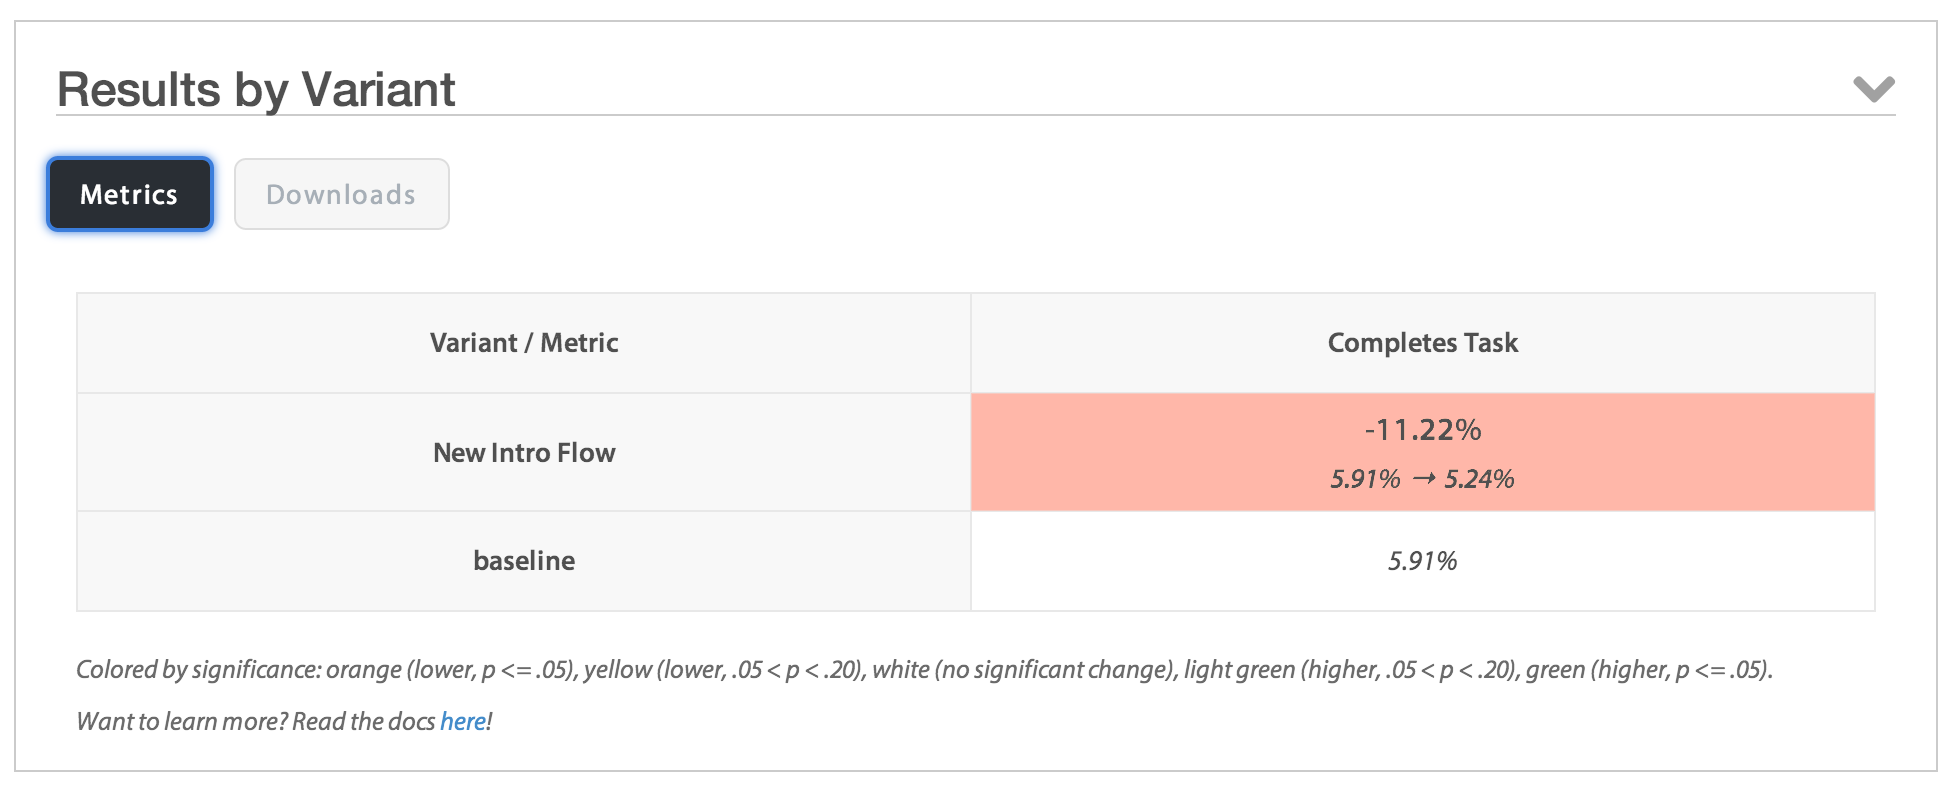
This could be due to the fact that the original intro flow is more intuitive. But based on your intuition and feedback from users, you really think the new version is better. This is the time to look at segmented data to better understand if something else is happening.
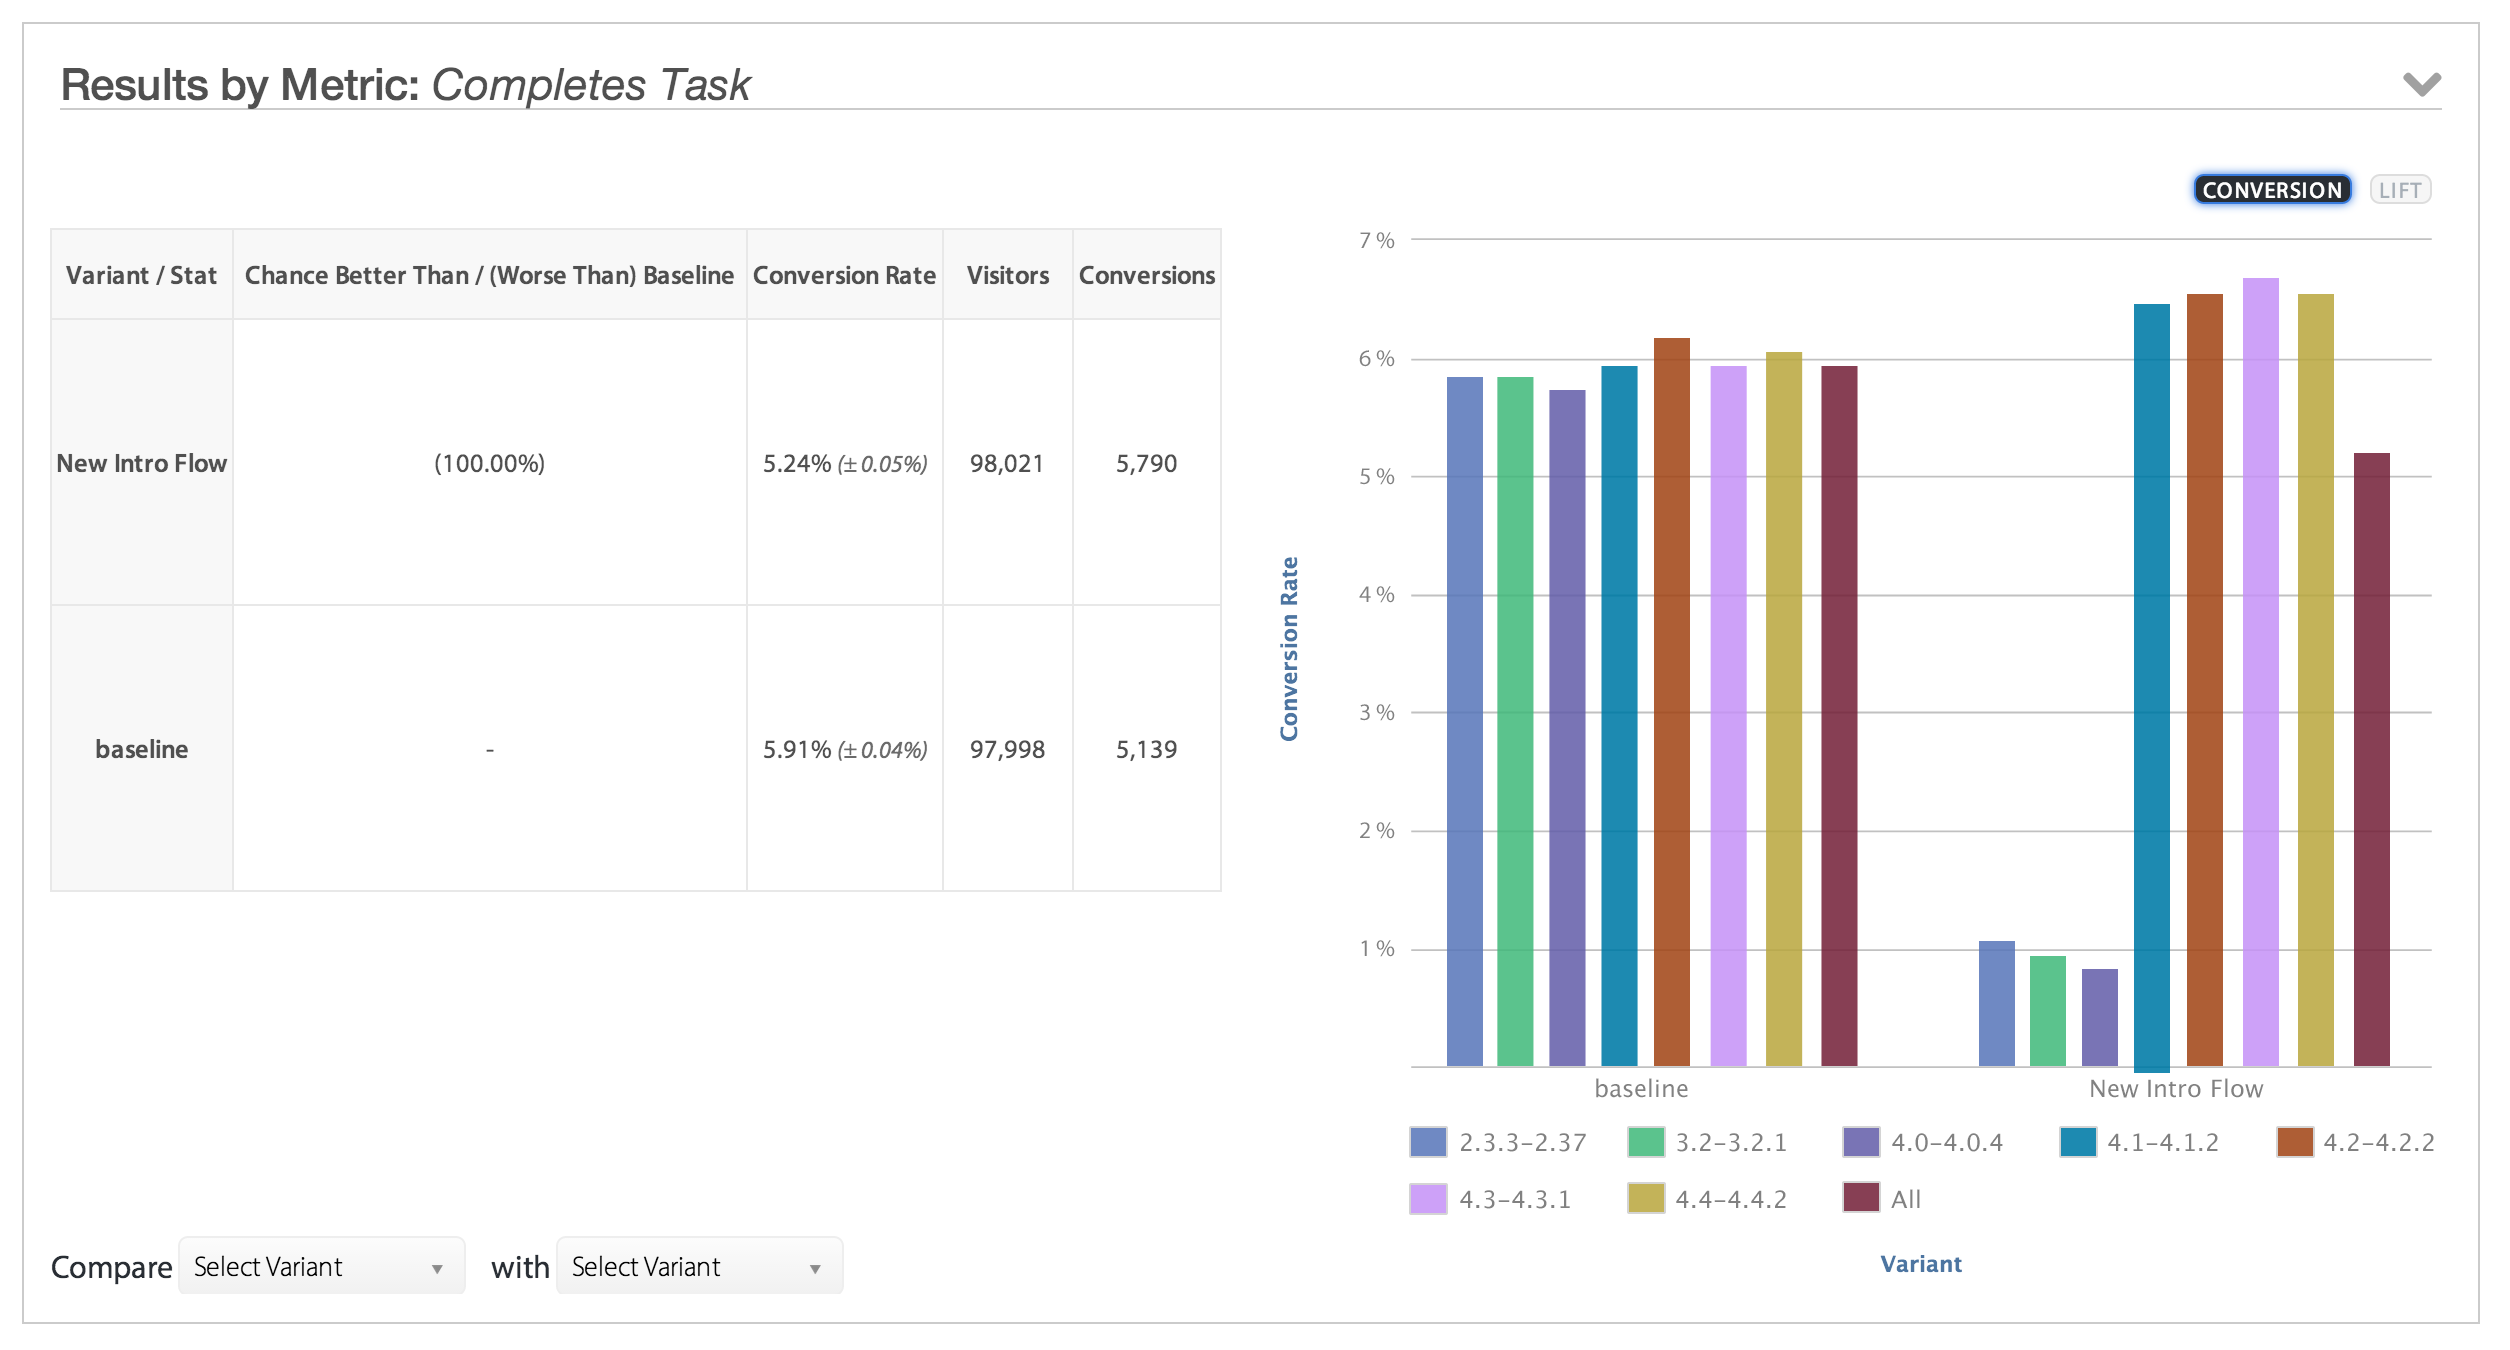
The segmented data reveals that the negative reviews are actually only due to the app having performance issues on a subset of Android versions. The design of the new flow doesn’t need to be discarded, the code needs to be reworked a bit for further testing.
New vs. Existing
Another classic source of bias in A/B testing results can come from not separating new from existing user behavior. Existing users are accustomed to the app as it is because their past visits have built up habits, knowledge, and expectations of the app. Seeing a change to an existing user’s app might cause an unduly negative response because they have to relearn how to use the app or it can cause an unrepeatable improvement in engagement because they are curious what the new icon means.
Demographic and Geographic Differences
A user’s demography (e.g. gender, age, etc.) and geography can also cause biases in A/B testing results. Your new purchase button that uses a brightly clashing color might appeal to young users but not older ones. Or a new denser layout could be more appealing to users in China but not users in the US.
Conclusion
The reason for difference in performance between two app variants can be due to the reason you expect, but sometimes the reason can be something totally unintentional. Looking at different slices of segmented data can help you uncover the truth.
Thanks for
reading!
More articles you might be interested in:
When to Use Multivariate Testing vs. AB Testing
Deciding between sequential and multivariate testing without knowing their advantages and limitations can pose significant challenges. If you’re looking to optimize your app’s conversion rate, sequential A/B tests, or experiments with two variants, usually do the trick. But in some...
Read MoreGet Started with Mobile A/B Testing using ONE Easy Test
I talk to a lot of app developers and product managers on a regular basis about A/B testing their mobile app. The feedback I hear the most is: “I know I need to start A/B testing, but we just haven’t...
Read More5 Easy Ways to Improve Your App with A/B Testing
Here are 5 ideas for relatively easy to implement tests to visual aspects of your app. You most likely won’t need to rework user flows or do a lot of complex coding. These are layout and design changes that can...
Read More