A Primer on Mobile User Retention
Solid mobile user acquisition channels? Check.
Onboarding? Could use some tweaking.
User retention? …..needs work.
If you’ve got decent traction for your app already, retaining mobile users likely is your top objective.
Yet retention is often this nebulous term everyone says they’re focused on but few actually put into practice. So what does a strong user retention framework look like, and how do we specifically build it?
That’s exactly what we’re going to focus on for the next few weeks.
If you have questions like:
- “How do I measure retention?”
- “What are best practices to increase retention?”
- “How do I increase MAUs?”
- “How do I re-engage my users?”
- “How many users should I expect to have by next year?”
- “What’s a reasonable goal for growth?”
- “What specific tactics and patterns can I use to make my app a habit?”
You’ve come to the right place.
Visualizing User Retention
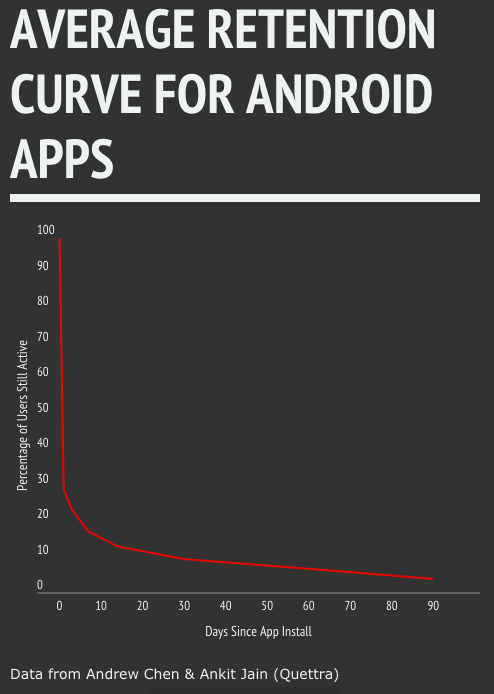
In order to increase user retention, we first have to understand what retention looks like and how to increase it. The average retention curve for mobile apps looks like this:
This graph is visualization of an acquisition cohort. A cohort is simply a group of users who share a common characteristic. An example of a cohort may be all iOS users, all users on Android 10.1, or all users in a specific geographical region.
With an acquisition cohort, we’re looking at all users who signed up on a specific day and tracking their engagement over time.
Cohorts are incredibly useful tools to track improvements in retention. If you look at only Monthly Active User (MAU) counts, you’ll be unable to attribute whether growth (or stagnation) is due to improvements in retention or your new efforts in user acquisition.
This particular graph looks at everyone who installed the app on a specific day, and tracks their activity over a period of 90 days, measuring how many users were active on each day subsequent to the day of the install.
There’s 2 key things to note about this curve:
- There’s a steep initial drop off between Day 1 and Day 3 – For any product (and in particular mobile products) this drop off is fairly typical. However, if you look at retention curves for the top mobile apps, you’ll note that a key difference between them and the average app is Day 1 – Day 3 retention rates.
- The curve is trending towards 0 – Looking at the graph, we can infer that the curve will eventually reach 0 if the X-axis were extended. This is a bad sign. It signals that users are not getting value out of the product and that eventually all users will drop off.
Bad Retention Inhibits Growth
So how do these 2 problems affect growth?
Let’s take a look at how cohort performance contributes to the most common growth metric: Monthly Active Users.
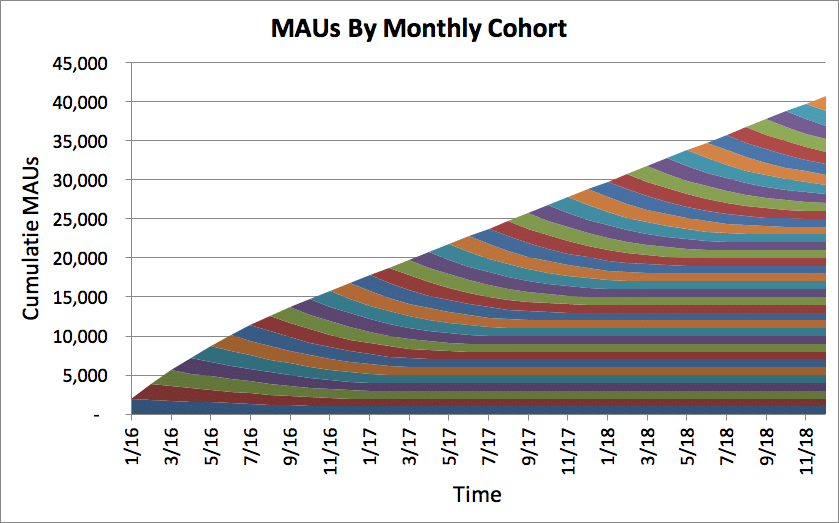
In the graph below by Dan Wolchonok, a product and analytics expert at Hubspot, you can see how monthly cohorts stack together to show growth over a period of 1 year.
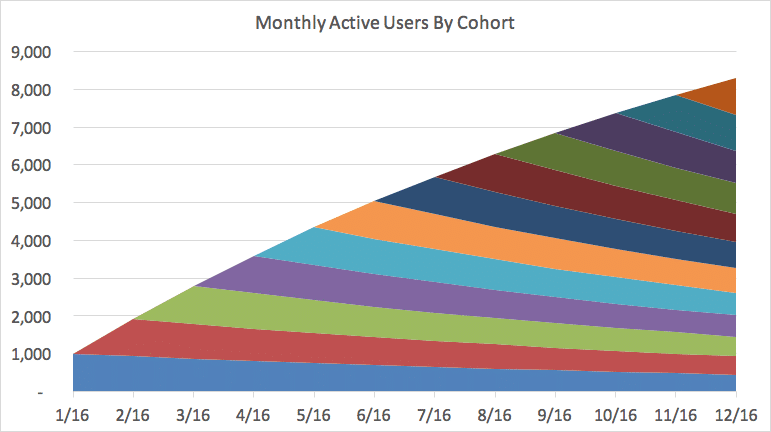
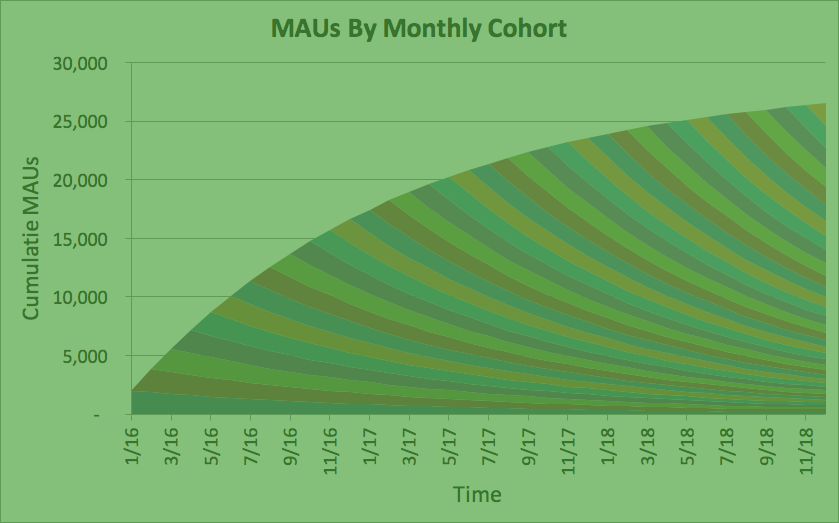
Each striation color represents a monthly cohort. Note that over time, each cohort decreases in size (as expected). In the short term, this looks like slow steady growth. As we know though, cohorts for the average app start to approach zero as time goes on, making the curve look like this:
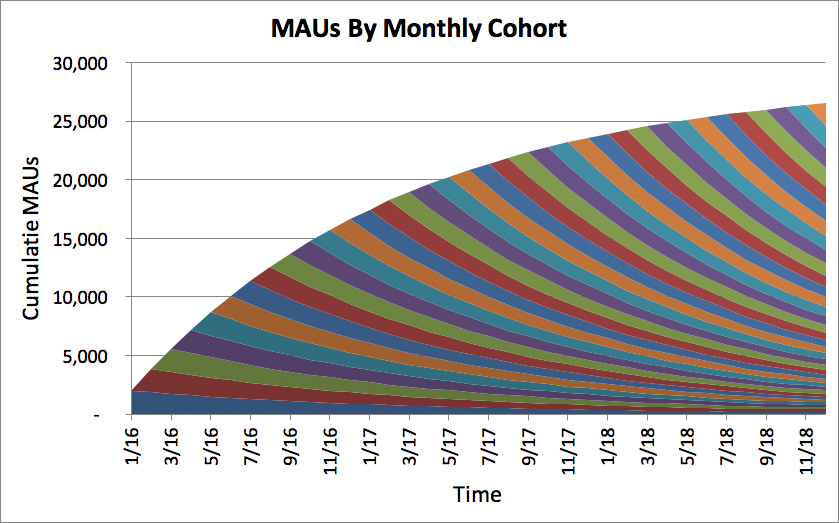
MAU growth slows dramatically over time, even if user acquisition stays at a steady rate. As each cohort approaches zero, your userbase shrinks almost as rapidly as the number of new users funneled in. As a result, growth plateaus.
How to Fix Your User Retention Problem(s)
So now we’ve identified the 2 problems (and keys to growth):
Retention is trending toward zero, which leads to plateauing growth in both MAUs and Revenue
Most apps suffer from horrible Day 0-Day 3 retention
This means that there are 2 main things you need to do to improve retention:
1. Flatten the Curve for Healthy Growth
“A good retention curve always flattens out at some point.”
-Brian Balfour, Former VP of Growth, Hubspot
The bad ones go to zero.
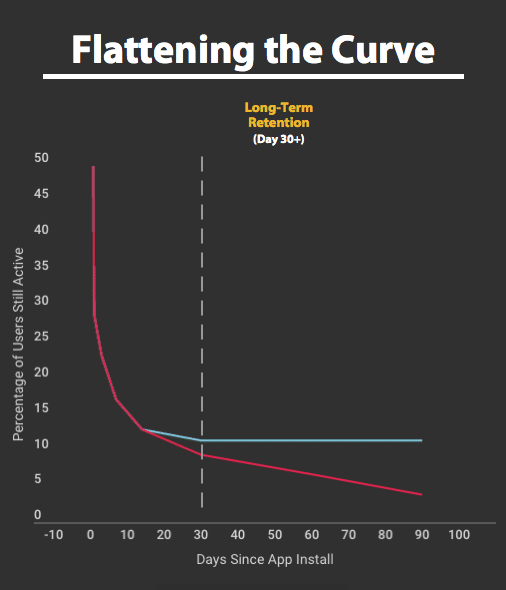
A flattening of the curve (blue line) signals that users are getting value out of your app. It also means that you have a solid foundation with which to build upon and grow. Now, rather than getting that plateauing growth, you’ll see strong increases over time.
If user retention starts to flatten out at ~50% (which is not uncommon among top apps), the MAU growth curve starts increases significantly faster at a linear pace.
Keep in mind that this graph assumes user acquisition levels are constant over time (2000 new users every month for perpetuity). Based on what we know about vitality, your growth rate will also increase dramatically faster due to social sharing.
In addition to this, flattening out the curve means that Monthly Recurring Revenue (MRR) will grow over time as more users repeatedly engage with the app and get more value out of it. Since users continue paying, they become more valuable over time. Instead, you get this:
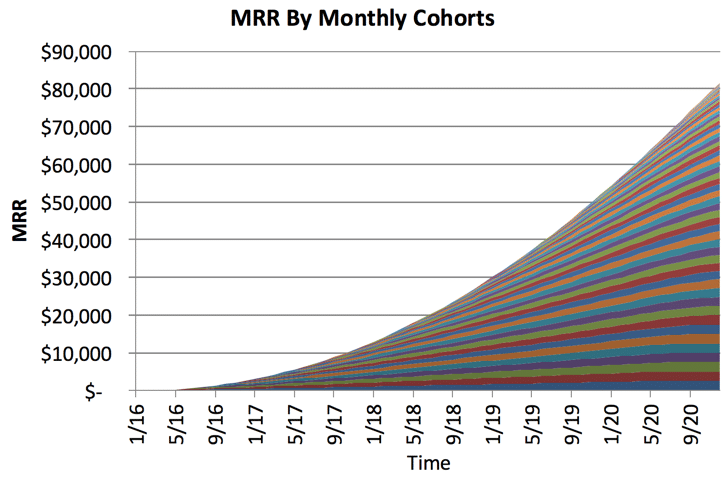
Coveted hockey stick growth.
In upcoming blog posts we’ll be talking about specific techniques to flatten the retention curve. Sign up for our newsletter to receive the next posts at the bottom of this page.
2. Shift the Retention Curve Up to Accelerate Growth
The second way to improve retention is to shift the entire retention curve up by targeting the first time user experience.
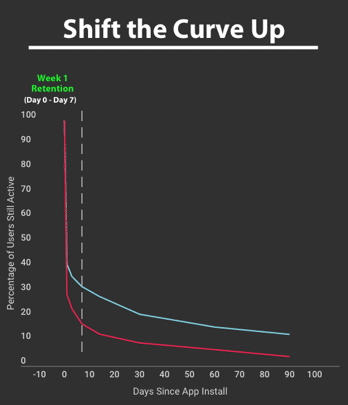
While flattening the curve simply ensures you have healthy growth, targeting the first time user experience hugely increases the speed of growth. When we take a look at the retention curves of top apps, it’s evident that Day 1 – Day 3 retention is a huge factor in success.
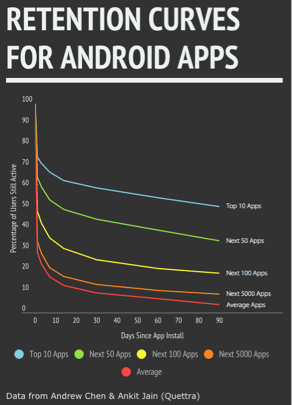
In the retention curves above, we saw that the top 10 apps had almost double the D1-D3 retention rates of the average app. However, the drop off happens at about the same rate as the average app.
This means that “users find the top apps immediately useful, use it repeatedly in the first week, and the drop off happens at about the same speed as the average apps.” In other words, if you onboard users correctly, you’ll rapidly accelerate your MAU growth by affecting the highest segment of users in your app.
“The best way to bend the retention curve is to target the first few days of usage, and in particular the first visit.”
– Andrew Chen, Supply Growth, Uber
We’ve already talked extensively about User Onboarding, but here’s the gist of it:
Target the first time user experience and onboard new users to get them to their Aha! Moment. This greatly increases their likelihood to retain and shifts the entire retention curve up.
Building a Foundation for Retention
To get growth right, you’ve got to focus on the 2 major retention problems: user drop off within the first few days and the fact that most retention curves trend toward zero.
To fix this, you need to focus on 2 major changes:
- Shifting the curve up
- Flattening the curve.
Over the next few weeks, we’re going to dig into retention from start to finish. We’ll talk not only about high-level strategies and how they affect your KPIs, but also deep, tactical examples from real apps that will make your app even stickier.
Sign up for the newsletter to learn about:
- How to track retention
- Methods for increasing retention
- Techniques for shifting the curve up
- Techniques for flattening the curve
- Real life examples of retention experiments
- How to make your app into a habit
- Building for long term retention
Thanks for
reading!
More articles you might be interested in:
Why Mobile Growth Is Actually About App Retention: How Optimizing In-App Experience Leads To 2x Faster Growth
Trying to grow your active user base is a lot like trying to fill up a leaky bucket. The bigger the hole, the faster you have to add more water and the more time and resources you have to spend...
Read MoreHow to Measure User Retention and Track Improvement
“How do I track and measure user retention?” If you’re managing a fairly successful mobile app, you’ll inevitably run into user retention issues. User acquisition tactics can get you quick traction, but building sustainable, long-term growth all comes down to...
Read MorePersonalizing Mobile User Onboarding
Feel like going to the Giants game at the last minute? Gametime is an app that let’s do just that and buy last minute tickets with just two taps on your phone. It avoids the hassle of printing or picking...
Read More